# xgb_param I encountered
xgb_params = {
    'learning_rate':      0.08501257473292347,
    'lambda':             8.879624125465703,
    'alpha':              0.6779926606782505,
    'max_depth':          6,
    'subsample':          0.6012681388711075,
    'colsample_bytree':   0.8437772277074493,
    'colsample_bylevel':  0.5476090898823716,
    'colsample_bynode':   0.9928601203635129,
    'scale_pos_weight':   3.29440313334688,
}
Finally hit Expert level
0. Introduction
While exploring tabular Kaggle competition, I encountered an unusual learning rate of 0.08501257473292347 in a Kaggle notebook. This sparked my curiosity about the optimization method used, leading me to discover Optuna.
- the actual notebook I encountered on ISIC 2024 - Skin cancer detection
Those peculiarly precise parameter values aren’t random – they’re the product of Tree-structured Parzen Estimator (TPE) optimization
This notebook is a curated collection of such advanced techniques that Kagglers just seem to know.
0.1 Index
- Tree-structured Parzen (TPE) Estimator
- qLora - finetuning llm
1. Tree-structured Parzen Estimator
TLDR; Weak conclusion: TPE optimizer is better than random search. TPE optimizer should be the default because it is faster and more accurate. This was the result from a small experiment via Kaggle tabular Mental Health Data.
TPE optimizer final score - 0.94269
Time taken: 245.37 seconds
random search final score - 0.94168
Time taken: 1064.37 seconds
What is TPE Estimator?
Short description: Bayesian optimization algorithm that models the probability of hyperparameters given their performance, using two separate distributions for good and bad outcomes to efficiently search the hyperparameter space.
Simplified: Instead of typical search like try 1,2,5,10, it takes the previous guess and takes gradient like step using probabilistic models. Like a game of ‘hot and cold’ where it learns which areas are ‘warmer’ and ‘colder’
1.1. Using TPE for XGBoost Optimization
Let us try it on real data. Following is a snippet from Kaggle’s Exploring Mental Health Data data.
- Response variable: ‘Depression’ column, binary 0 or 1
- 141k rows of data, 18 feature columns
| id | Name | Gender | Age | City | Working Professional or Student | Profession | Academic Pressure | Work Pressure | CGPA | Study Satisfaction | Job Satisfaction | Sleep Duration | Dietary Habits | Degree | Have you ever had suicidal thoughts ? | Work/Study Hours | Financial Stress | Family History of Mental Illness | Depression |
|---|---|---|---|---|---|---|---|---|---|---|---|---|---|---|---|---|---|---|---|
| 0 | Aaradhya | Female | 49 | Ludhiana | Working Professional | Chef | 5 | 2 | More than 8 hours | Healthy | BHM | No | 1 | 2 | No | 0 | |||
| 1 | Vivan | Male | 26 | Varanasi | Working Professional | Teacher | 4 | 3 | Less than 5 hours | Unhealthy | LLB | Yes | 7 | 3 | No | 1 | |||
| 2 | Yuvraj | Male | 33 | Visakhapatnam | Student | 5 | 8.97 | 2 | 5-6 hours | Healthy | B.Pharm | Yes | 3 | 1 | No | 1 |
You can find my full experiment notebooks below
1.2 test 1
- Same upper bound and lower bound for both random search and TPE optimizer
Note that TPE optimizer will never suggest values outside the specified range. Same with random search.
# random search code simplified
param_dist = {
    'n_estimators': [100, 200, 300, 400, 500],
    'max_depth': [3, 4, 5, 6, 7, 8, 9, 10],
    'learning_rate': [0.01, 0.1, 0.2, 0.3],
    'subsample': [0.6, 0.7, 0.8, 0.9, 1.0],
    'colsample_bytree': [0.6, 0.7, 0.8, 0.9, 1.0],
    'min_child_weight': [1, 2, 3, 4, 5, 6, 7, 8, 9, 10]
}
# TPE optimizer code simplified
params = {
'max_depth': trial.suggest_int('max_depth', 3, 10),
'learning_rate': trial.suggest_loguniform('learning_rate', 1e-3, 1.0),
'n_estimators': trial.suggest_int('n_estimators', 100, 500),
'min_child_weight': trial.suggest_int('min_child_weight', 1, 10),
'subsample': trial.suggest_uniform('subsample', 0.6, 1.0),
'colsample_bytree': trial.suggest_uniform('colsample_bytree', 0.6, 1.0),
}Random Search took four times the amount of time to calculate and performed worse than TPE
TPE optimizer final score - 0.94269
- Time taken: 245.37 seconds
random search final score - 0.94168
- Time taken: 1064.37 seconds
1.3 test 2
Let us increase the upper bound and lower the lower bound and see what happens
# Random search code with increased ranges in both directions
param_dist = {
    'n_estimators': [10, 50, 100, 500, 1000, 2500, 5000],
    'max_depth': [1, 3, 5, 8, 10, 15, 20],
    'learning_rate': [0.0001, 0.001, 0.01, 0.1, 1.0, 5.0, 10.0],
    'subsample': [0.1, 0.3, 0.6, 0.7, 0.8, 0.9, 1.0],
    'colsample_bytree': [0.1, 0.3, 0.6, 0.7, 0.8, 0.9, 1.0],
    'min_child_weight': [0, 1, 10, 25, 50, 75, 100]
}
# TPE optimizer code with increased ranges in both directions
params = {
'max_depth': trial.suggest_int('max_depth', 1, 20),
'learning_rate': trial.suggest_loguniform('learning_rate', 1e-4, 10.0),
'n_estimators': trial.suggest_int('n_estimators', 10, 5000),
'min_child_weight': trial.suggest_int('min_child_weight', 0, 100),
'subsample': trial.suggest_uniform('subsample', 0.1, 1.0), # Upper bound must be 1.0
'colsample_bytree': trial.suggest_uniform('colsample_bytree', 0.1, 1.0), # Upper bound must be 1.0
}Similarly, Random Search took twice the amount of time to calculate and performed worse than TPE.
Increasing the parameter search bounds did not help get a better score for both methods!
TPE optimizer final score - 0.94216
- Time taken: 1925.50 seconds
random search final score - 0.94168
- Time taken: 2886.15 seconds
1.4 visualization
To keep it fair, both were given 100 chances to find the optimal hyperparameter.
Let us compare the two optimization by steps.
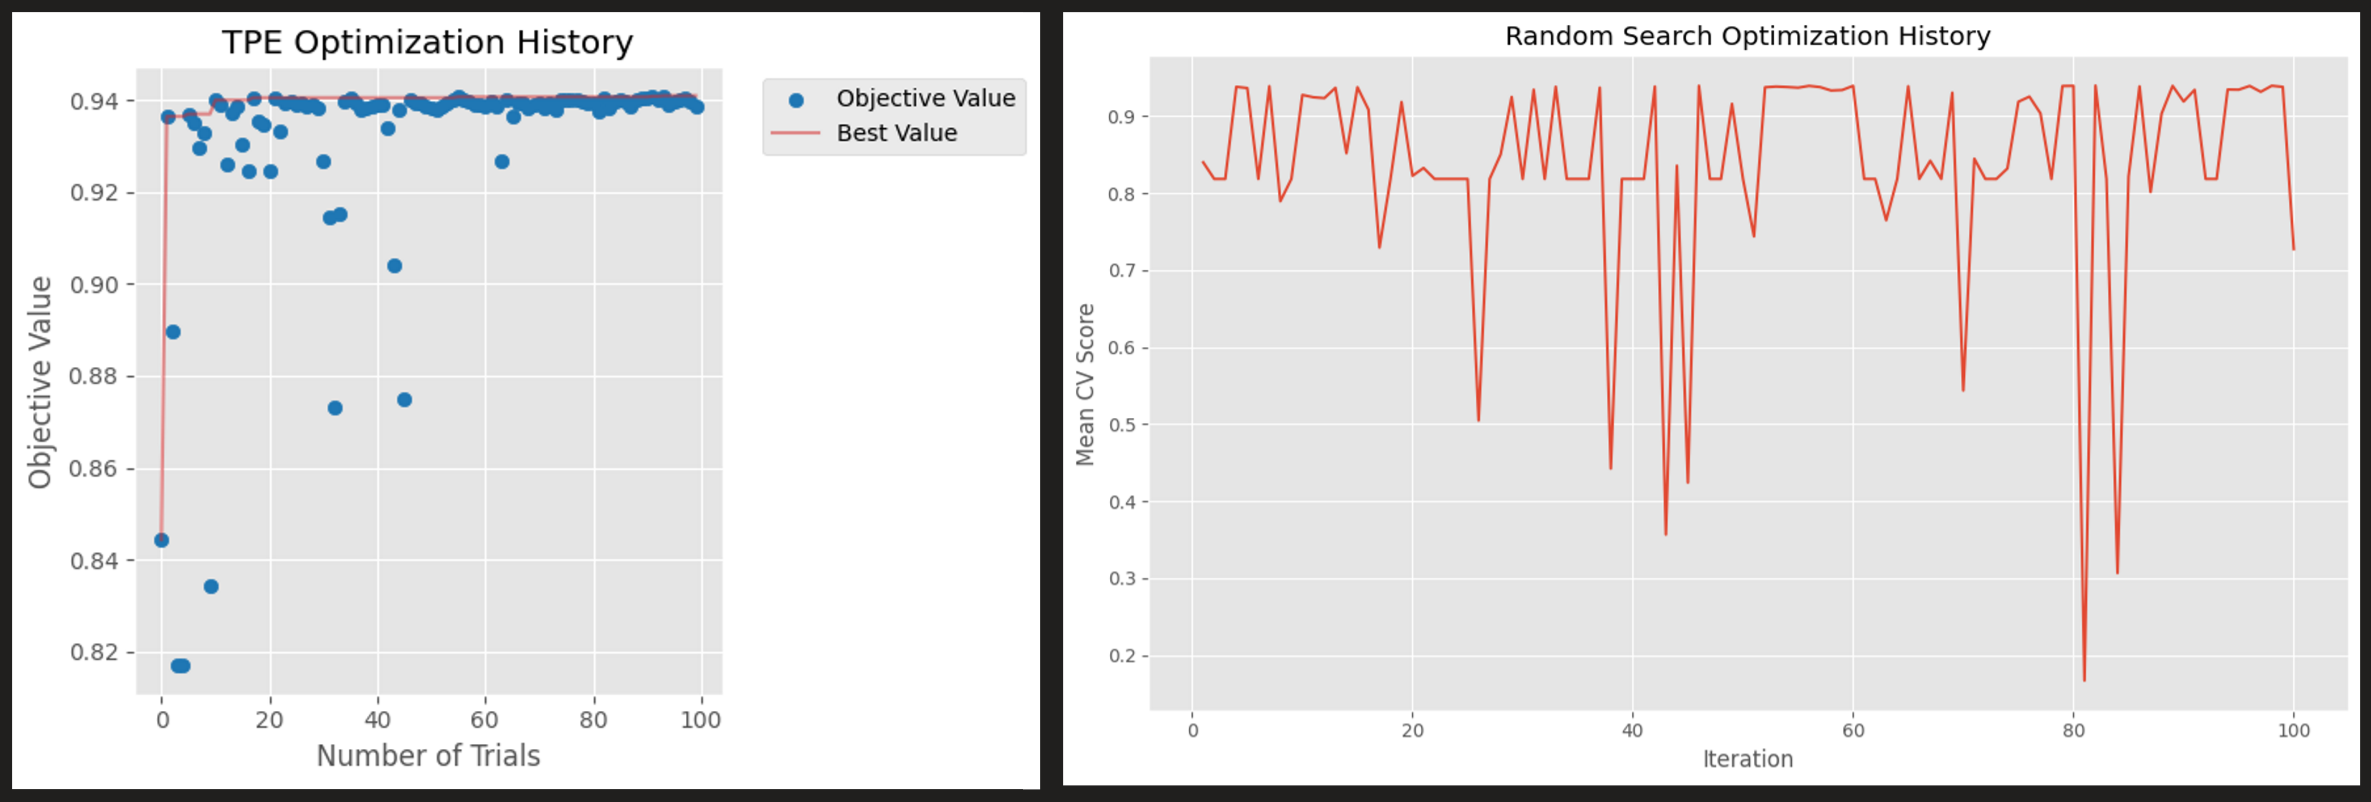
On the left is TPE optimization history.
Little to no exploration on the second half of the trial
Converges to Mean cross validation score of 0.94 at step 40-50
On the right is random search history
Lots of exploration and volatility
Does not converge due to limitation on fixed parameter values
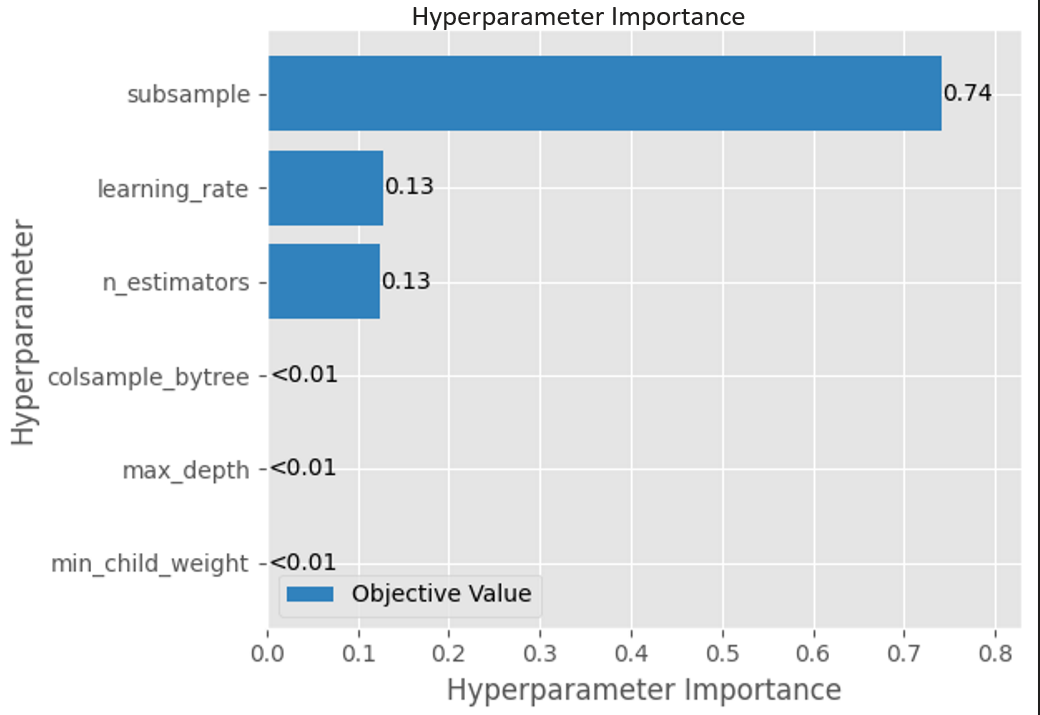
Optuna provides explanability tool called FanovaImportanceEvaluator.
- Random forest regression model is fit on historical trial data
- This is done after TPE optimizer completes its iterations. So note that the following hyperparameter importance has nothing to do with Bayesian statistics.
Further reading
Here’s how TPE works step by step:
Collect History:
Run initial trials and collect pairs of (hyperparameters, performance) Sort these results by performance
Split Data:
Define a threshold γ (gamma) that splits results into “good” and “bad” groups Typically, γ is set to be the 25th percentile of observed results Points above γ → good results (l(x)) Points below γ → bad results (g(x))
Build Distributions:
Create two probability distributions: l(x): Distribution of hyperparameters that led to good results g(x): Distribution of hyperparameters that led to bad results Each distribution is built using Parzen estimators (kernel density estimation)
Calculate Next Point:
For each potential new point, calculate the ratio l(x)/g(x) The higher this ratio, the more likely the point is to give good results Select the point with the highest ratio as the next point to evaluate
Iterate:
Evaluate the selected point Add the result to history Return to step 2
Extra: Super simple visualization intro to Bayesian optimization (recommend read-15min)
1.5 Conclusion
TPE-optimized XGBoostClassifier achieved a score of 0.94269, remarkably close to the competition’s winning score of 0.94488. This demonstrates how effective hyperparameter optimization can be, even without complex feature engineering or model ensemble.
While studying TPE optimizers, I discovered that hyperparameter optimization has evolved significantly beyond this classical approach. Recent advances have introduced more sophisticated algorithms:
Multivariate TPE improves upon traditional TPE by capturing dependencies between hyperparameters, leading to more efficient optimization1.
CMA-ES (Covariance Matrix Adaptation Evolution Strategy) has shown superior optimization quality compared to TPE in recent studies
2. LoRA llm training
Finetuning large language models like Qwen and Gemma are a breeze for Kagglers
Let us try it ourselves
2.1 Using LoRA: First Attempt and Analysis
Here is my first attempt at LoRA
Experiment Setup
- Model: Gemma with LoRA tuning
- Dataset: Reddit essay collection
- Full Implementation: Available in my notebook on Kaggle
Test Results
Prompt:
Write a 100-word essay on the importance of artificial intelligence.Generated Output:
Write a 100-word essay on the importance of artificial intelligence.

Answer:

Artificial intelligence is a technology that has the ability to simulate human intelligence. It is a technology that has the ability to simulate human intelligence.
It is a technology that has the ability to simulate human intelligence. It is a technology that has the ability to simulate human intelligence. It is a technology that has the ability to simulate human intelligence. It is a technology that has the ability to simulate human intelligence. It is a technology that has the ability to simulate human intelligence. It is a technology that has the ability to simulate human intelligence. It is a technology that has the ability to simulate human intelligence. It is a technology that has the ability to simulate human intelligence. It is a technology that has the ability to simulate human intelligence. It is a technology that has the ability to simulate human intelligence. It is a technology that has the ability to simulate human intelligence. It is a technology that has the ability to simulate human intelligence. It is a technology that has the ability to simulate human intelligence. It is a technology that has the ability to simulate human intelligence. It is a technology that has the ability to simulate human intelligence. It is a technology that has the ability to simulate human intelligence
What is the issue?
The output reveals several critical issues:
Extreme repetition of the same phrase
Unnecessary formatting texts (repeating the prompt)
Questions raised
Parameter issue? - LoRA has Rank, Alpha as core parameters
Train set issue?
Learning rate issue?
Prompting issue?
2.2 Parameter tuning (todos)
Reduced LoRA Rank: Lower rank can help if you only have a small dataset.
Better Decoding Settings: Using temperature and top_p encourages more diverse text rather than repeating phrases.
Slightly Larger Batch: Batching more than 1 item at a time can stabilize gradients.
Higher Quality Data: Filtering the data to ensure variety and well-formatted prompts drastically reduces repetition.