0. Introduction
Continuing my Kaggle journey, I joined two more new competition.
![]()
1. ISIC Cancer Detection
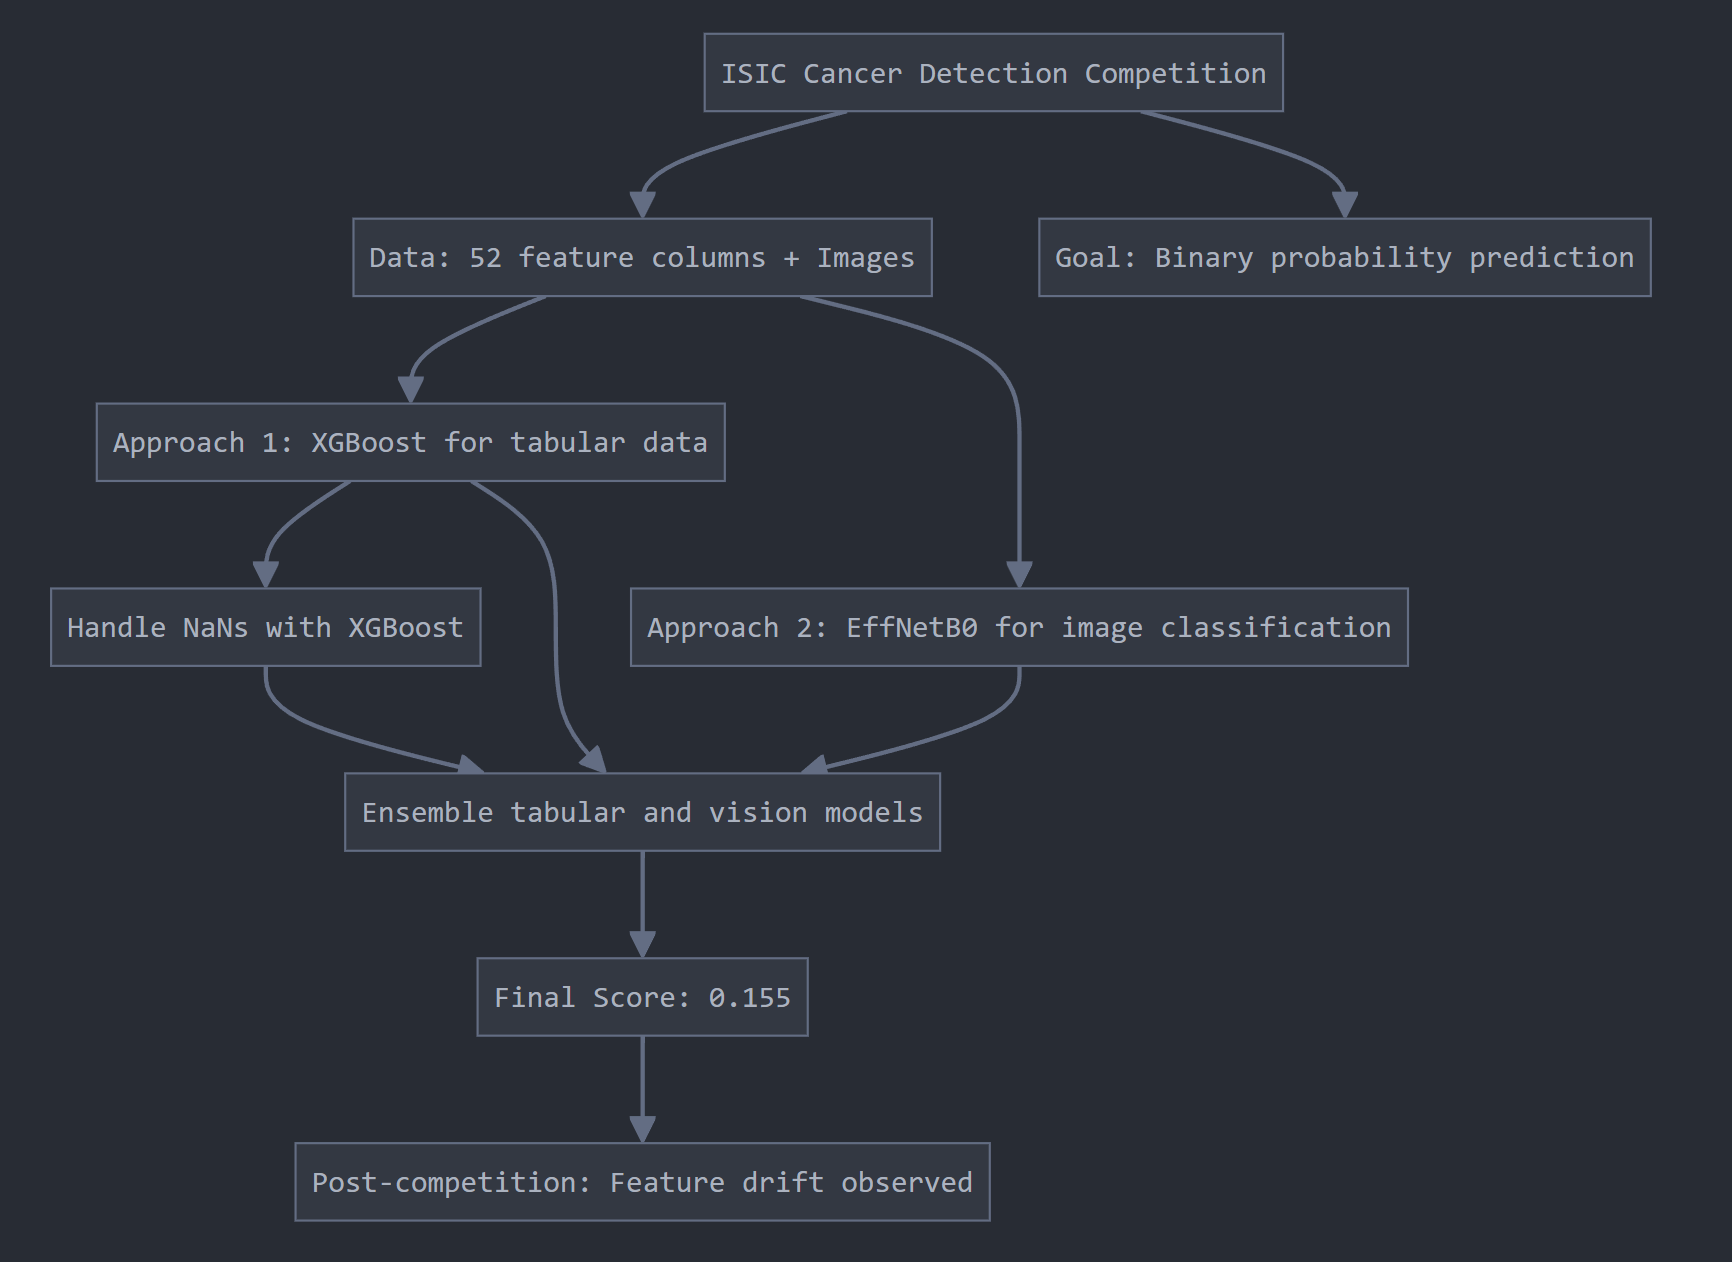
This is a simple structured+unstructured data, binary probability prediction competition. An example of a prediction may look like isic_id=001567, target=0.98 meaning that there is 98% probability that malignant cancer is present. For features, there are 52 feature columns such as lesion_diameter, image_type, sex and age_approx. Additionally, we are given 401064 of such rows including matching number of images for corresponding rows in the table.
Similar to idea from Poisonous mushroom notebook, I wanted to test the idea of fulfilling every nans using XGBoost. To my surprise this method improved the submission score by 2% going from 0.150 (nans unhandled) to 0.152 (nans handled).
Additionally, I built a image classification model using EffNetB0 and this only scored 0.132 by itself. Ensembling the tabular and vision models, I added a column to the tabular data by recording vision model’s probability score instead of classification. In XGBoost, you can call best_model.predict_proba() to achieve this.
Putting all together, it was able to get 0.155 (For comparison, winning solution had score of 0.172)
After this competition ended, they used the ‘real test set’ and interestingly, in this scoring, computer vision model had a higher score than tabular model when measured seperately. Suggesting feature drift in the data.
2. Ariel Data Challenge 2024
Try run the interactive visualisation below! Just click the play button.
This is the most complicated competition I’ve encountered on Kaggle, especially with all the different metrices in number of files used to record a transit event of an exoplanet in front of a distant star.
I was interested in visualising the transit event so I wrote some code to display the pixel over time below. Draft notebook 1
Following shows AIRS signal data of an exoplanet at a distant star during transit versus outside transit duration.